

Risk-Standardized Performance (RSP) and Making Comparisons
Updated for CFSR Round 4!
Read responses to questions about the Child and Family Services Review (CFSR) statewide data indicators, risk-standardized performance (RSP), and making comparisons.
Last updated: October 2022
RSP is used to assess state performance on the CFSR statewide data indicators compared to national performance. RSP accounts for some of the factors that influence performance on the indicators over which states have little control. One example is the ages of children in care; children of different ages have different likelihoods of experiencing an outcome (e.g., achieving permanency), regardless of the quality of care a state provides. Accounting for such factors allows for a fairer comparison of each state’s performance relative to the national performance.
The goal of RSP is to provide a fairer comparison of state performance to national performance and other states. RSP should be used only as an indication of how a state is performing relative to national performance or other states. States should use their observed performance to monitor improvement over time within the state on CFSR safety and permanency data indicators.
The specific factors used to determine RSP depend on the statewide data indicator. The factors include children’s age (depending on the indicator, it is the child’s age at entry, first day of the reporting period, or initial victimization), the state’s foster care entry rate, and the risk of a child in the state experiencing the outcome for the specified indicator. For more information on which factors are used for specific indicators, see the CFSR Statewide Data Indicator Series.
RSP is calculated using a complicated statistical model. For a detailed explanation of the methodology, see Attachment A of CFSR Technical Bulletin #13A (2022). In brief, a state’s RSP is calculated by dividing the observed number of children that experienced the outcome by the number of children expected to experience the outcome.1 This ratio describes how much higher or lower the state performed than expected. The ratio is multiplied by national performance to convert it to a percentage or rate (depending on the indicator) and create the RSP value.
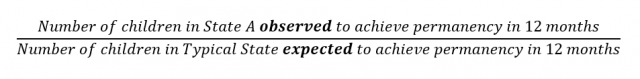
For example, we take the number of children entering foster care that are observed to achieve permanency within 12 months of entering foster care in State A (calculated using State A data), and divide that by the number of children entering foster care that are expected to achieve permanency within 12 months based on a typical state with a similar child population as State A (calculated using national data). See ratio below:
In this example, State A is observed to achieve permanency in 12 months for 350 children who entered foster care during a 12-month period. For a typical state with a similar child population, 290 children are expected to achieve permanency in 12 months of entering foster care, resulting in a ratio of 1.2:
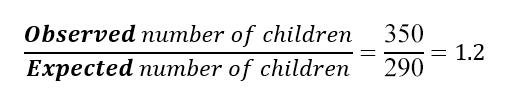
State A did 1.2 times better than expected achieving permanency within 12 months for children who entered foster care.
The national performance for this indicator is 35.2%. We multiply the ratio of 1.2 by national performance to change the ratio to a percentage and calculate State A’s RSP of 42.2%.
1 Per CFSR Technical Bulletin #13A, the ratio used is the predicted number of children / the expected number of children. For the purposes of this document, we use the term observed in place of predicted to minimize confusion; the two are very close in value.
To determine whether a state’s performance is statistically better, worse, or no different than national performance, we calculate a 95% confidence interval estimate for the state’s RSP. The interval accounts for the uncertainty associated with the RSP value. In other words, we are 95% confident that the value of the RSP is between the lower and upper limit of the interval. The RSP interval is what we use to compare state performance to national performance. If the interval overlaps national performance, the state's performance is statistically no different than national performance. If the interval is above or below national performance, it is statistically different than national performance. Whether higher or lower performance is desirable depends on the desired direction of performance for the indicator.
For example, State A’s RSP is 42.2% and the RSP interval ranges from 41.1% to 42.9%. When we compare State A’s RSP interval to national performance for permanency in 12 months for children entering foster care of 35.2%, the entire interval is above 35.2%:
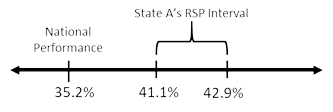
Because a higher value is desirable for this indicator, State A performed statistically better than national performance, after taking into account some of the factors over which State A has little control.
Syntax used by CB to calculate RSP for each state uses a national, risk-adjusted model that requires child-level data from all states (i.e., national datasets) and thus cannot be replicated by states and other interested parties.
RSP takes into account some of the factors over which states have little control and that are not accounted for in the observed performance.
To calculate RSP, a statistical model is used to compare a state’s observed performance to its expected performance. The result of the statistical model is a ratio that is applied to national performance to show how different a state was relative to national performance—not relative to the state’s observed performance.
For example, State A’s observed performance for permanency in 12 months for children entering foster care is 33.8%. That is, for all children who entered care during the year, 33.8% of those children achieved permanency within 12 months of entering foster care. State A has an unusually large proportion of younger children in its child welfare population, and we know that younger children are less likely than older children to achieve permanency in 12 months. Because more of the younger children achieved permanency than we otherwise would have expected, the statistical model takes that factor for State A into consideration when calculating State A’s RSP of 42.2%.
A state’s RSP cannot be compared to its observed performance. RSP takes into account some of the factors over which a state has little control and calculates performance relative to national performance. RSP has no meaning relative to the state’s observed performance.
In our example, State A has an observed performance of 33.8%. State A has an unusually large proportion of younger children in foster care, so we account for that along with other factors when making adjustments to calculate the state’s RSP of 42.2%. When State A’s RSP interval of 41.1% to 42.9% is compared to national performance of 35.2%, State A performed better than the nation.
On the other hand, let’s say that State A has an unusually large proportion of older children in care instead. Its observed performance is still 33.8%. However, we expect more children who enter foster care in 12 months in State A to achieve permanency than if State A’s case mix had more younger children. As a result, State A’s performance is adjusted to calculate an RSP of 30.1% and an RSP interval of 28.9% to 30.7%. When that interval is compared to national performance of 35.2%, State A performed worse than the nation.
In both scenarios, the observed performance for State A was the same. The RSP changed depending on the proportion of older or younger children in State A’s foster care population.
A state’s observed performance on the statewide data indicators should not be compared to the national performance. The observed performance does not take into account some of the factors over which states have little control. The goal of RSP is to provide states with a fairer way of comparing performance to national performance.
For example, State A’s observed performance of 33.8% does not account for the high proportion of younger children in its population so comparing it to national performance of 35.2% would not be a fair comparison. Comparing the two would make it appear State A’s performance is worse than it is, based on State A having a different case mix than the nation.
RSP should only be used to compare a state’s performance to national performance. It also allows a better way to compare across state performance. It helps identify areas of strength and improvement needs on the CFSR safety and permanency data indicators relative to national performance.
A state’s observed performance is used to determine how the state performs based on its actual child population, to identify how the state performs on an indicator over time, and to determine how performance on one indicator (e.g., permanency in 12 months) relates to another indicator (e.g., reentry to foster care). Observed performance data also helps identify areas of strength and improvement needs on the CFSR safety and permanency data indicators and is used to produce supplemental context data to help understand state performance information included in CFSR Data Profiles.
Series
Find information about using CFSR statewide data indicators to assess performance on child safety and permanency outcomes. Updated for Round 4!